Description of Our Site and Environments
The Central Arizona–Phoenix Long-Term Ecological Research (CAP LTER) project is one of 26 long-term sites funded by the National Science Foundation (NSF). The CAP LTER site provides a unique addition to the LTER research by focusing on an arid-land ecosystem profoundly influenced, even defined, by the presence and activities of humans and is one of only two sites that specifically studies the ecology of urban systems.
Biological, physical, engineering, and social scientists from Arizona State University and a wide range of local partners are working together to study the structure and function of the urban ecosystem, assess the effects of urban development on the Sonoran Desert, and define the impact of ecological conditions on urban development.
The project also has an explicit commitment to engage the broader community in research efforts, both through K-12 education initiatives and through activities to engage citizens in CAP science.
Natural Environment
 Arizona is a state of diverse local climates and closely juxtaposed life zones. No fewer than seven climate subregions exist within the state and at least five major vegetation communities lie within the CAP LTER study area.
Central Arizona stands astride major geographic transition zones between the Sonoran and Chihuahuan Deserts and the Sierra and Rocky Mountain ranges. Its weather patterns are dominated by events and moisture originating in the Pacific Ocean, as well as the Gulf of Mexico.
With less than 7 inches of annual rainfall, Phoenix is situated in an arid landscape with concomitant reliance on surface or groundwater, a high evaporation rate of moisture, and a growing urban heat island.
Climate
 There are two separate rainfall seasons in the Sonoran Desert. The first occurs during the winter months from November through March when the area is subjected to occasional storms from the Pacific Ocean. While this is classified as a rainfall season, there can be periods of a month or more in this or any other season when practically no precipitation occurs. Snowfall occurs very rarely in the Salt River Valley, while light snows occasionally fall in the higher mountains surrounding the valley. The second rainfall period occurs during July and August when Arizona is subjected to widespread thunderstorm activity whose moisture supply originates in the Gulf of Mexico, in the Pacific Ocean off the west coast of Mexico, and in the Gulf of California. The spring and fall months are generally dry, although precipitation in substantial amounts has fallen occasionally during every month of the year.
Sunshine in the CAP LTER area averages 86% of possible, ranging from a minimum monthly average of around 78% in January and December to a maximum of 94% in June. During the winter, skies are sometimes cloudy, but sunny skies predominate and the daytime temperatures are mild (over 60°F). During the spring, skies are also predominately sunny with warm temperatures during the day and mild pleasant evenings (over 60°F). Beginning with June, daytime weather is hot (over 100°F). During July and August, there is an increase in humidity, and there is often considerable afternoon and evening cloudiness associated with cumulus clouds building up over the nearby mountains. Summer thundershowers seldom occur in the valley before evening.
The autumn season, beginning during the latter part of September, is characterized by sudden changes in temperature (often the minimums drop from 80°F to less than 70°F). The change from the heat of summer to the mild winter temperatures usually occurs during October (no more 100°F days). The normal temperature change from the beginning to the end of this month is the greatest of any of the twelve months in central Arizona. By November, the mild winter season is definitely established in the Salt River Valley region. The annual mean is therefore in the 70°F range.
The earth’s surface temperature in Phoenix during mid-afternoon can easily exceed 50°C (122°F) (orange areas on the map 1). and go up to over 58°C (136°F) (red areas on map 1). These areas are dry vacant or desert remnants in the urban area. Areas with lower temperatures are typically moist surfaces such as agriculture, irrigated residential, or areas at higher elevations (note yellow to green areas). Nighttime is famous for development of the urban heat island in Phoenix – note the warmer temperatures over 34°C (93°F) in the city core compared to less than 28°C (82°F) on the outskirts of the metro area. Heat is retained by artificial surfaces which slowly release their stored heat from daytime absorption, such as dark asphalt/concrete surfaces, canyon-like street level areas with buildings, etc.
A typical distribution of earth’s surface temperature is shown for day (2 pm) and night (2 am) for mid summer in the Phoenix metro area. The temperatures were derived from a satellite platform system that flies by Phoenix twice a day – called the Advanced Very High Resolution Radiometer (AVHRR) system. It shows the mean temperatures per one kilometer square areas. The patterns on the maps have been smoothed cartographically.
Flora
 The CAP LTER study area is located in the Sonoran Desert. The area is considered a rain shadow desert but, thanks to its two rainy seasons, is fairly lush compared to other deserts. Mild winters with only few instances of frost have fostered the development of a unique vegetation evolved mostly from subtropical thornscrub species that still occur at its southern edge.
Two life forms visually dominate the landscape and distinguish the Sonoran Desert from other North American deserts, small trees belonging to the pea family (Leguminosae) and the large columnar cacti.
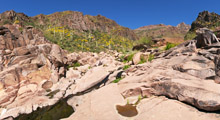
The CAP LTER area is located at the edge of the Lower Colorado River subdivision of the Sonoran Desert, barely reaching into the Arizona Upland or Foothills subdivision. The valley floor is dominated by widely spaced, low shrubs, primarily creosote (Larrea), bursage (Ambrosia), and brittle bush (Encelia), while a rich and denser saguaro-palo verde (Carnegia and Parkinsonia) forest covers the foothills. After good winter rains, the ground is covered with colorful spring annuals.
The chief constraint on desert plant growth is water availability. Substrate conditions retarding the evaporation or percolation of water from surface soil layers prolong the time and increase the amount of soil moisture. Lower relief areas receive the flowing surface water from upper terraces and plains so that ephemeral washes provide a wetter environment than their surroundings. Additionally, soils containing larger amounts of rocky material, especially common on mountain or butte slopes, reduce the loss of moisture to the atmosphere or water table. As a consequence subtle differences in relief and substrate determine species composition, and both areas of sparse uniformity as well as dense thickets, often occur in close proximity.
Fauna
 The Northern Cardinal (Cardinalis cardinalis) and the Cactus Wren (Campylorhynchus brunneicapillus) can serve as examples for native birds that are also established in the urban environment. The cardinal is widespread across most parts of the US, while the wren is a Sonoran Desert species. The wren builds a nest in which it not only raises the chicks, but stays around all year round and roosts inside. In the desert all nests are found on cholla cactus (Cylindropuntia spp.) only, but in the city the wrens use a variety of plants, and sometimes other structures (we found a nest on the TV dish).
The Great-tailed Grackle (Quiscalus mexicanus) is abundant in the urban landscape and agricultural fields, and probably extended its distribution in the Southwest by using human-managed habitats as stepping stones. It is totally dependent on high water availability and cannot persist in the Sonoran Desert.
Geology
 The rocks and landscape of the CAP LTER area have developed as a result of a history that began in the Proterozoic eon, about 1.7 billion years ago, when this portion of the North American continent was assembled by island arc — continent collisions and igneous activity (such as that seen today in western South America). These rocks formed the basement for deposition of limestones, siltstones, and sandstones (such as those that were deposited in the Grand Canyon region) during the Paleozoic and Mesozoic eras (544 to 65 million years ago). Regional uplift and erosion during the Laramide orogeny (or mountain-building event) of the early Tertiary (about 50 million years ago) eroded the Paleozoic and Mesozoic rocks, stripping the landscape down to the Proterozoic basement. In the Tertiary period (65 to 2 million years ago), the region underwent two periods of crustal extension, during which basins that formed were filled with debris, and one period of extensive volcanism. During the Quaternary period (1.6 million years ago to the present), debris from erosion of the preexisting mountain ranges and formation of the lower Colorado River drainage system developed the current landscape. The last 10,000-8,000 years before the present (known as the Holocene epoch) have seen the development of the current Sonoran Desert ecosystem, which set the final stage for human settlement of the region.
This simplified geologic map of the greater Phoenix area overlain on shaded relief for the area shows the major geologic units by age. Proterozoic rocks (reddish) core the mountain ranges with Tertiary sediments (tan-yellow) overlying or igneous rocks intruding them in places. Quaternary basin and river sediments shown in light yellow have accumulated in the low relief central portions of the Valley covering the basin floors and burying the edges of the mountains (AZGS 1:100,000 geologic maps overlying 30 DEMs).
Back to topHuman Environment
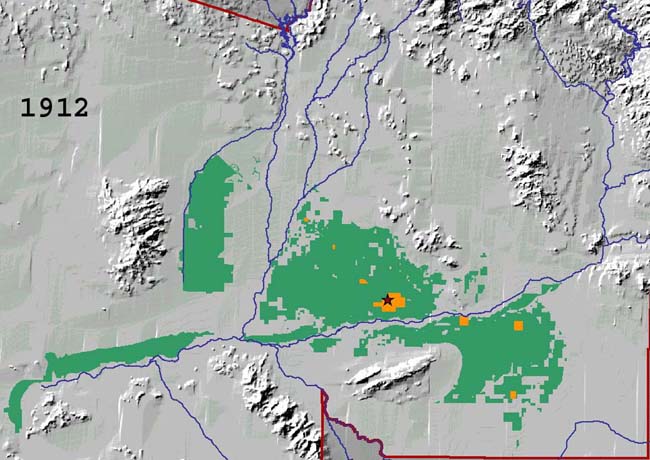
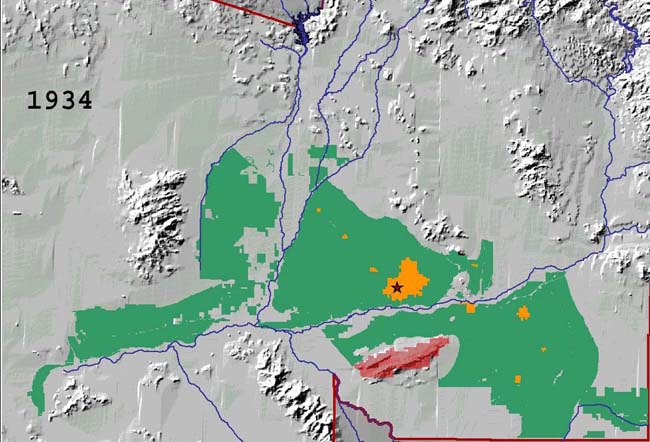
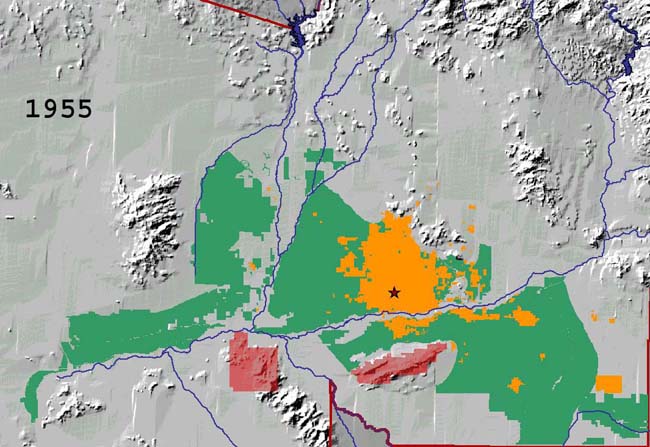
 People have long settled in the Phoenix region, drawn to the broad alluvial basin with its surface and ground water resources. Agriculture played a predominant role in the Valley between 1870 and 1920, by which time Phoenix had established itself as the largest city in Arizona. In the post World War II period, urbanization began replacing fields with houses, commercial establishments, and urban infrastructure. Phoenix emerged as one of the largest cities in the United States in the 1990s and as one of the fastest growing metropolitan areas. Present land use change involves desert conversion to urban uses.
Hohokam Settlement
Prehistoric towns and villages were located along the Salt River in the area of current day CAP LTER study site. Native American oral histories refer to this ancient culture as Hohokam, an O’odham word that means “Finished-Ones.” By A.D. 750 the Hohokam built complex irrigation systems that directed water from the Salt River to their fields of corn, cotton, and squash. The Phoenix metropolitan area literally was built over the remains of this advanced prehistoric culture, much of which was excavated during ten years of freeway construction.
Settlement from the 1800s Forward
 In 1863 President Lincoln established the Arizona Territory, and in 1867 the first hay camps were established along the Salt River. In 1870 a Phoenix town site was delineated to include present-day streets of Central and Washington. The area was actively promoted as a rural area to encourage growth along the agriculture periphery. In 1895 the first railroad service linked the Phoenix area to Southwest, Midwest, and Eastern markets. By the end of its first stage of development, Phoenix was a compact and well-defined city with functional zones for a central business district, industry and residential districts. It had established itself as the a dominant market center between El Paso and Los Angeles.
 Private capital and federal funding implemented major improvements throughout the prosperous 1920s. Roads, bridges, water, and sewer lines were created with federal funding and engineering assistance. This construction boom also produced many “skyline” buildings in downtown Phoenix, as well as industrial development to the south of the downtown area. Cultural development also flourished after 1920, with private support for music, drama, and the arts. Many museums, libraries, schools, and parks were built in the 1920s and the Valley became a regional focus for culture and the arts. Due to an aggressive annexing policy established in the 1930s to promote rapid demographic growth, the city gained “metropolitan district” status as a result of the 1940 census results. Of special note is the creation of South Mountain Park by the city of Phoenix. This remains the largest city park in the nation and established the precedence for setting aside close-in mountain areas as preserved open spaces.
 The population of the Valley more than tripled between 1940 and 1960 for several reasons. Federal investments in military aviation made it possible for the city to attract high-tech companies during the post-war years. Also many military personnel who were stationed in the Valley during the war returned here afterwards to settle with their families. Additionally, political forces facilitated both spatial and industrial growth after the war. A promotional campaign tried to attract high-tech industry to the Valley by touting the healthful climate, natural beauty, right-to-work employee status, skilled labor pool, and plentiful energy provided by Arizona Public Service (APS) and SRP for industry. A steadily increasing per capita income produced a populace that sought technical products for a cosmopolitan lifestyle.
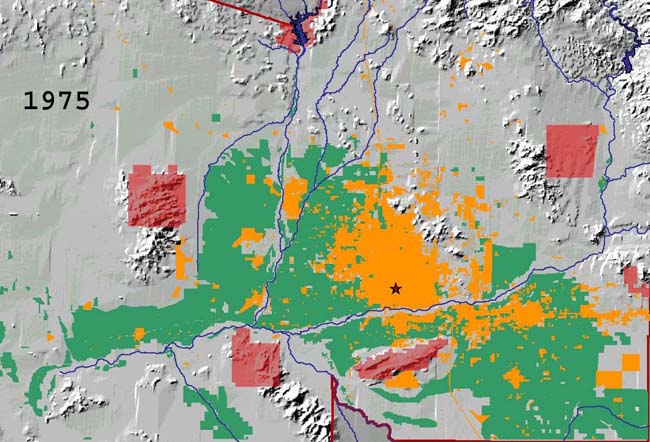 The growth spurt that began in the 1940s in the Valley continued through the 1970s in an intense period of urbanization and by 1960 over 75% of the population resided in urban areas, as opposed to just over a third of the population in 1870. This reflected a national trend towards urbanization with migration occurring westward and from rural areas and smaller cities to larger urban areas. Conversely, while the urban area continued to grow, agricultural areas decreased due to urban expansion. Few physical limitations, availability of low cost land, and tax policies that promoted expansion have all been responsible for growth in the Valley.
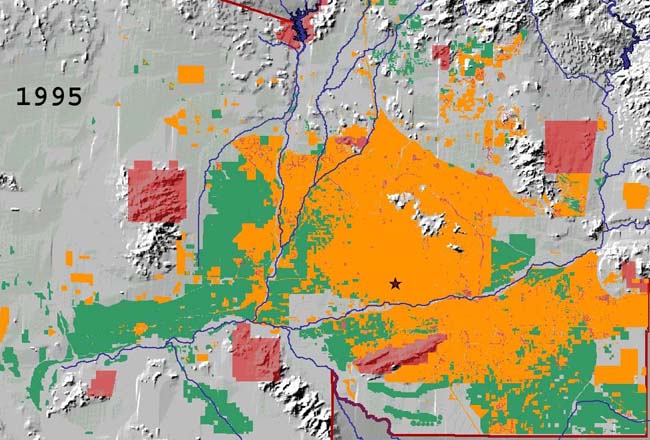 The greater Phoenix metropolitan area experienced a growth rate three times greater than that of the average U.S. rate between 1982 and 1992. Maricopa County was the third-fastest growing of the nation’s top 50 counties by number of people from 1980 to 1994. Between 1954 and 1994, Maricopa County experienced a 564% growth rate, as compared to a 72% rate in the U.S. Most of the draws to the Valley have been economic in nature. An economy built on “copper, cattle, cotton and citrus,” shifted into a more diversified one based on real estate, construction, electronics, aerospace, retirement, service, and tourism. Growth continued in the information, communications, health, services, aerospace, transportation/distribution, agribusiness, and tourism industries.