Long-Term Monitoring and Experiments
Long-term monitoring and experiments are at the core of CAP LTER’s research program. They enable CAP scientists to examine changes over time, particularly in ecological variables that are slow cycling. In the rapidly growing Phoenix metropolitan region, long-term studies also allows scientists to monitor changes as urbanization takes place in urban fringe areas and as density increases in already urbanized areas.
Atmospheric Deposition
The atmospheric deposition monitoring program is designed to explore patterns of material deposition across the greater Phoenix metropolitan area and surrounding Sonoran desert.
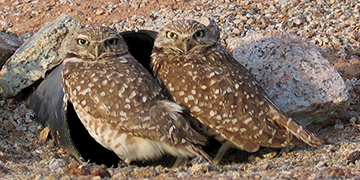
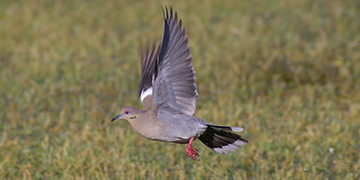
Bird Censuses
The CAP LTER has been using a standardized point-count protocol to monitor the bird population in the greater Phoenix metropolitan area and surrounding Sonoran desert region since 2000.
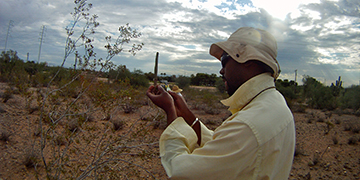
Desert Fertilization Experiment
(Previously Carbon and Nitrogen Deposition)
CAP LTER investigators are testing the hypothesis that distinct biogeochemical pathways result from elevated inorganic nitrogen and organic carbon deposition from the atmosphere to the land.
Ecological Survey of Central Arizona (ESCA)
(Previously Survey 200)
The Ecological Survey of Central Arizona is an extensive field survey and integrated inventory designed to capture key ecological indicators of the CAP LTER study area.
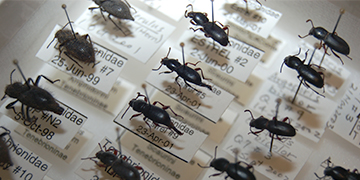
Ground-Dwelling Arthropods
The CAP LTER has been collecting arthropods since 1998 using a simple but effective technique called pitfall trapping.
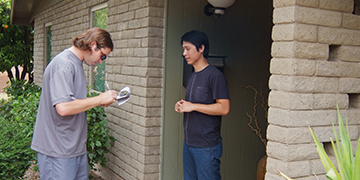
Phoenix Area Social Survey
The Phoenix Area Social Survey (PASS) parallels the Ecological Survey of Central Arizona/Survey 200 as a major component of CAP’s long-term monitoring program.
Regional Drinking Water Quality Monitoring Program
ASU has been working with regional water providers and metropolitan Phoenix cities since 1998 on algae-related issues affecting drinking water supplies, treatment, and distribution.
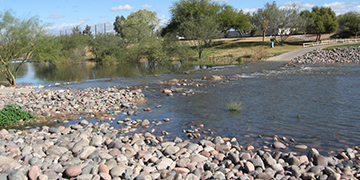
Salt River Biodiversity
The CAP LTER began monitoring birds and herpetofauna (reptiles + amphibians) at select locations along the Salt River in 2012.
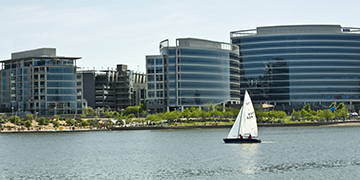
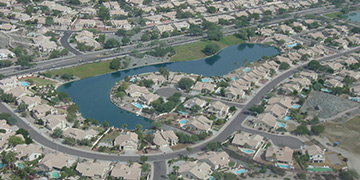
Tempe Town Lake Water Quality
The CAP LTER has been monitoring water quality in the Tempe Town Lake, a man-made reservoir in the heart of Tempe, AZ since 2005.
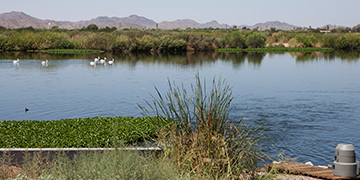
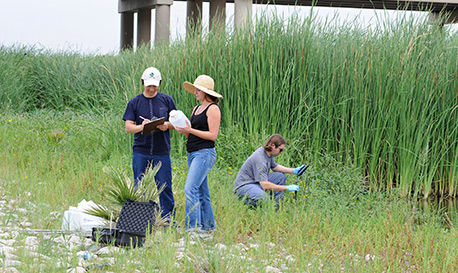
Tres Rios Wetland Dynamics
The CAP LTER is developing robust water and nutrient budgets for the Tres Rios constructed wetland in Phoenix, AZ USA.
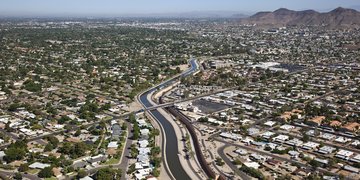
Urban Stormwater
The CAP LTER has been monitoring stormwater runoff at the outflow of the Indian Bend Wash to investigate stormwater dynamics and watershed functioning in aridland, urban environments.
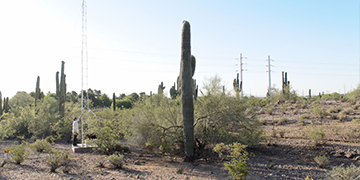
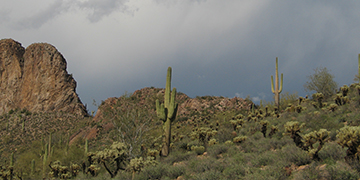
Weather Stations: Papago Park and Lost Dutchman State Park
The CAP LTER maintains two 10-m micrometeorological stations in the greater Phoenix metropolitan area, including at Lost Dutchman State Park and at Papago Park.